Showing posts with label data. Show all posts

Wednesday, January 15, 2020

Coaching Resolutions Challenge #1

My friends at Eduro Learning are doing a 10 Coaching Resolution Challenge to kick off the new year. I'm a little on the crazy, busy side right now, but everyone always is, so I refuse to use that as an excuse. I also want to help them spread the word and model best practice to their educators studying for the Coaching Micro-credential. The first challenge was about defining your role as a coach. I decided a more fitting choice for me would be to focus on redefining a certain aspect of my role. I have often supported fellow educators with thinking up creative ways to collect data, but rarely get involved in supporting them with analyzing the data. As we all know, gathering data is all well and good; but, if nothing is actually done with the data -- what was the point? I want to work more with educators to ask the questions that come after data is collected.
Things like:

  • What could this data possibly mean?
  • Now that we have this data, do we need more? If so, what type?
  • What actions does this data suggest we should take?
  • If we take action on this data, when should we gather more to evaluated impacts?

Tuesday, October 31, 2017

Interesting Things in Blogger Stats

If you aren't a regular consumer of your Blogger stats, please read this entire message and check out the photos. There is always some rather interesting and even slightly bizarre information in that stats. First, I have always been a big supporter of the map. It is one of my favorite ways to see where traffic is coming from, but the numerical break down by country is also useful. It can really make you start to question, why? Why is traffic coming from there? For example, why so many readers from Russia? I don't offer any content in Russia, so why the traffic. Recently I added an ad campaign for my site, because Google Adsense was offering a free month. BOOM! I suddenly get super popular in Russia -- click farms for sure.

The next piece of information that is always compelling to me are the what browsers and what operating systems. How in the world is 34% of the traffic coming from Internet Explorer? Seriously? Why would someone still be using it? I mean I know it is popular here in Korea, but only 57 viewers to my blog were from Korea, which means another 416 people from other places were using it. Strange. I dumped that browser years ago and I'm not going back people. Seriously folks, join the rest of us on Chrome and Firefox. I'm not surprised by the 65% from Windows operating system. Disappointed, but not surprised. I'm disappointed because that many people still opt for an inferior product, but I guess that is life and it explains the Internet Explorer situation.
Beyond all of that, there is something else noteworthy here -- look at all the data they have on you! They know where you are, what type of device you are using, and what type of browser... Privacy? That is a dead concept gang!

Tuesday, October 18, 2016

Part 4: Let's Talk about Accountability

If your position or department has recently be created, you have some serious work cut out for you. In a previous post, I mentioned getting runs on the board to build your brand within the school. Even if your department or position is clearly defined and has been around awhile, you should still track your time. There are several apps on the market for doing this, but I decided to build my own with a Form. The link is to a copy of the Time Taker Form, I only ask that you create your own copy and then edit and adjust as you need. The Form allows me to record, what type of work I do, who I do it with, how long it takes, and notes to explain in detail what was done.

I was once involved in a rather heated debate about using this Form with a colleague. His argument was that our positions were created and therefore our time and work was understood and did not require defending. I, on the other hand, felt that our positions had been created, but that management did it on a leap of faith; they really had zero idea about what we did or how we did it. Tracking our time was a way to show what type of work we did and how much time that work took. A visible way to describe our role as an EdTech Department.
In the end, we agreed to disagree about that matter, but I still feel that tracking your time is a valuable tool. Especially if you are planning to request more time, money, and/or staff for your team. Believe me -- administrators and school boards are going to ask why you need more. If you can't physically show them, you aren't going to get more time, money, or staff. Tracking your time is doing yourself a favor; plus, it provides that all important component of accountability. If being accountable frightens you, you should stop working in education; you should especially quit working in EdTech. This is a job for self motivated people who get things done, not for lazy lumps.

First, you should provide more than one type of data. Second, you should share this information with your Admin Team and review it. Draw conclusions from it; use it to suggest trends and problems that can be solved. We use student data to drive instruction; we should use perforemce data to make decisions about funding and staffing. 

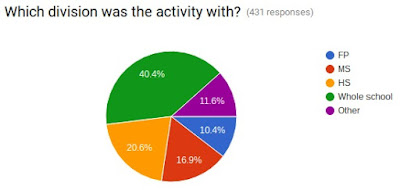
If you look at the results I have from Term 1 of SY2016-17, you see that some interesting information comes to light very quickly. I spend a great deal of my time focused on the
entire school (40.4%). After that high school (20.6%), middle school (16.9%), and First Program (FP; 10.4%) get my time in that order. This opens up questions as to why? Am I upable to help FP enough? Are FP teachers not requesting my support? How can we better serve FP? What type of support do they need?

You can also see that the majority of my time is spent creating & building (23.4%) and planning & research (25.9%). This makes a lot of sense considering the department didn't exist before. We are in a building phase and the department's role is being defined, but what should the trend be next year? Will the focus continue being creating & building and planning & research, or will it change to focus on co-teaching & co-planning? What direction do we want to move in as a school? Strategic thinking starts with looking at data and dicussing it, reflecting on it, and analyzing it. This leads to informed decision making on the institutional level.

The histogram provides more interesting information. The vast majority of my time is spent in activities and meetings that last less than 60 minutes. What you don't see in the chart, but you can understand from the spreadsheet, is that multiple short times are being used to complete tasks, which suggests that long periods of time to sit and focus on one project are actually difficult to come by in my day. This is only after one term! Imagine what we will have to look at after one year.

Part 3: Everybody's Cheerleader

Monday, March 7, 2016

Educational Leadership: 5 (Good) Ways to Talk About Data

The November issue of Educational Leadership was titled Doing Data Right. Of course, as educators we should be doing our best to improve instruction and assessment with data informing our choices, but it is a much easier thing to say than to do. One of the featured articles (5 (Good) Ways to Talk About Data) in the issues dealt specifically with how to move a school in the right direction with regard to working with data. The research that has been conducted about professional learning communities suggests that this five components are necessary to have data drive instruction and assessment of student learning.

  • Component 1: Students are the shared responsibility of everyone.
    • All of the students go to the same school, no matter the age -- take ownership and be involved. In my experience, this matter can be dealt with by vertical teams. The more teachers from various grade levels know each other, the more they seem to feel joint responsibility over all students. In the article, it was specifically pointed out that a team should take responsibility for everyones success and failure. This helps build trust.
  • Component 2: Conversations about data include healthy disagreement.
    • The key word is healthy. People need to be able to talk about what the data means and how it should be used. These discussions will involve differing opinions, but everyone must act professionally and with trust. 
  • Component 3: Conversations about data engender trust rather than suspicion.
    • Principals and teachers need to work together. The data shouldn't be used to point the finger, but to better understand how improvements can be made.
  • Component 4: Data teams take a solution-oriented process.
    • Focusing on the solution, rather than the problem. Looking at the data and asking, "What can we do better?" "How can we teach or assess better?"
  • Component 5: Data teams know what they're expected to accomplish.
    • Clear guidelines for what needs to be accomplished, but also room to explore the data and the conclusions. The article pointed out some examples where they witnessed teams trying to complete all the questions, rather than really thinking about the answers/solutions. On the other extreme, there were some teams that didn't seem to have any clear guidelines on what should be done. You need to have structure, but not so much that it becomes busy work for teachers.
Datnow, Amanda, and Vicki Park. "5 (Good) Ways to Talk About Data."Educational Leadership Nov.     2015: 10-15. Web.

Sunday, November 23, 2014

Student Data @ Saipan International School


SAT10 Overview and Comparison
One thing I like to do when possible is make data meaningful for students, parents, and teachers. Usually during meetings with the Board of Directors (BOD), it is the financial report that requires some explanation. All too often it is easy to simply see a bunch of numbers and still leave with the feeling,
SAT10 Grade Equivalent
"but what does it mean?" I have encouraged the BOD to ask questions about the financial report whenever they want and I try my best to point out the more important information and make it simple to understand. I think some administrators either don't bother doing this action for parents, or prefer the idea that parents not understand and therefore don't bother admin with questions or concerns. But this is a huge part of our job as admin, helping people make sense of numbers. During the last meeting, the BOD requested an academic report, so I have used our SAT10, AR, and Achieve 3000 data to put together an explanation of what type of learning is occurring at SIS.

Our first photo is the overview of the data from our SAT10 scores with comparisons to our previous year (2013) and the results from the Public School System (PSS). Our Complete Battery and Total Math are slightly down in 2014, but Total Reading is slightly up. The more interesting number isn't as obvious, but is quite important, across the board our number of students above the 50%tile are up. But what does that mean? Although there weren't as many individual students making high scores, more students scored above the 50%tile which translates to less students (including ELL students) falling below average. More student above the 50%tile is a huge improvement, because it means that all of our students are achieving more, not just the ones at the top. To give some perspective, I have included the SAT10 Grade Equivalent scores, which helps demonstrate just how far ahead our students are from their current grade level. Looked at with this lens, we see that only G6 and G8 reading are really places where we need to do some work. These are also grade levels where we have gained more ELL students this year, so that could be a factor.


Our AR Star Reading scores show some growth in most grade levels, but negative growth in G5 and G6. The grade equivalents are mostly below the current grade. One thing that needs to be considered when looking at this data is that again, it includes every student. The ones at the top and the ones at the bottom. Those who are native speakers of English and those that are just starting to learn. Later in the year, we will revisit this data and compare it with spring results. Historically, our students have shown more improvement in the second semester in reading.
Achieve 3000 is new to our school this year, but the potential for solid improvement in reading of non-fiction material is well documented. In the three grade levels where is has been truly implemented, we can already see gains, but in two of the grade levels we are below the desired score range. I don't see that as actually too concerning as of yet, the students and teachers are new to the program, so there is a learning curve in play, but the fact that scores have gone up is a positive note. We will revisit this data in the spring as well; especially because we will begin to have data from the other grade levels as they begin to use the program more.